


How to install and configure Prometheus & grafana in Red Hat Enterprise Linux 7
- Munshi Hafizul Haque

- Jul 27, 2020
- 4 min read
Updated: Oct 3, 2021
Prometheus is an open-source systems monitoring and alerting toolkit originally built at SoundCloud. The Prometheus ecosystem consists of multiple components, many of which are optional:
the main Prometheus server which scrapes and stores time series data
client libraries for instrumenting application code
a push gateway for supporting short-lived jobs
special-purpose exporters for services like HAProxy, StatsD, Graphite, etc.
an alertmanager to handle alerts
various support tools
Grafana is open source visualization and analytics software. It allows you to query, visualize, alert on, and explore your metrics no matter where they are stored. In plain English, it provides you with tools to turn your time-series database (TSDB) data into beautiful graphs and visualizations. Grafana supports querying Prometheus.
The architecture of Prometheus and some of its ecosystem components:

And Prometheus + Grafana could be the complementary services that consider as a tools to build up a monitoring system. Lets start the configuration.
Installing Prometheus Server:
Step:1 To download Prometheus binaries for Linux from https://prometheus.io/download/
# cd /tmp/
# wget https://github.com/prometheus/prometheus/releases/download/v2.20.0/prometheus-2.20.0.linux-amd64.tar.gz

::::::::::::: CUT SOME OUTPUT :::::::::::::

100%[========================================================================================================>] 65,312,139   287KB/s   in 5m 25s
2020-07-25 18:16:23 (196 KB/s) - ‘prometheus-2.20.0.linux-amd64.tar.gz’ saved [65312139/65312139]
Step:2 To prepared prerequisite configurations for Prometheus.
# ueradd --no-create-home -s /bin/false prometheus
# mkdir /etc/prometheus
# mkdir /var/lib/prometheus
# chown prometheus:prometheus /etc/prometheus
# chown prometheus:prometheus /var/lib/prometheus
Step:3 To extract downloaded zip file & configure Prometheus.
# tar -zxvf /root/prometheus-2.20.0.linux-amd64.tar.gz
prometheus-2.20.0.linux-amd64/
::::::::::::: CUT SOME OUTPUT :::::::::::::
prometheus-2.20.0.linux-amd64/LICENSE

# mv /var/lib/prometheus/prometheus.yml /etc/prometheus/
# chown -R prometheus:prometheus /var/lib/prometheus

# mv /var/lib/prometheus/prometheus.yml /etc/prometheus/
# ln -s /var/lib/prometheus/prometheus /usr/local/bin/prometheus
Step:4 To create a systemd configuration file for Prometheus.
# vi /usr/lib/systemd/system/prometheus.service
[Unit]
Description=Prometheus
Wants=network-online.target
After=network-online.target

[Service]
User=prometheus
Group=prometheus
Type=simple
ExecStart=/usr/local/bin/prometheus \
--config.file=/etc/prometheus/prometheus.yml \
--storage.tsdb.path=/var/lib/prometheus/ \
--web.console.templates=/var/lib/prometheus/consoles \
--web.console.libraries=/var/lib/prometheus/console_libraries

[Install]
WantedBy=multi-user.target
Step:5 To start the Prometheus service.
# systemctl enable --now prometheus
Created symlink from /etc/systemd/system/multi-user.target.wants/prometheus.service to /usr/lib/systemd/system/prometheus.service.
# systemctl status prometheus
Step:6 To open port in firewall, if firewall service is running.
# firewall-cmd --add-port=9090/tcp --permanent
# firewall-cmd --reload
Step:7 To verify the Prometheus service, open the URL http://<prometheus_ipaddress>:9090 using a client's browser.

OK, good to go for the next.
Installing Node_Exporter:
Prometheus receives metrics from many sources like machines, databases, applications, etc. But the most common Exporter that we prefer to install on each node to collect machine metrics is the node_exporter. Let's install the Node_Exporter.
Step:1 To download Node_Exporter from Prometheus Download Page.
# cd /tmp
# wget https://github.com/prometheus/node_exporter/releases/download/v1.0.1/node_exporter-1.0.1.linux-amd64.tar.gz
--2020-07-27 13:19:58--  https://github.com/prometheus/node_exporter/releases/download/v1.0.1/node_exporter-1.0.1.linux-amd64.tar.gz

::::::::::::: CUT SOME OUTPUT :::::::::::::

100%[========================================================================================================>] 9,520,728    149KB/s   in 57s
::::::::::::: CUT SOME OUTPUT :::::::::::::
2020-07-27 13:20:57 (164 KB/s) - ‘node_exporter-1.0.1.linux-amd64.tar.gz’ saved [9520728/9520728]
Step:2 To prepared prerequisite configurations for Node_Exporter.
# ueradd --no-create-home -s /bin/false prometheus
# mkdir -p /var/lib/prometheus/node_exporter
Step:3 To extract downloaded zip file & configure Node_Exporter.
# tar xvf node_exporter-1.0.1.linux-amd64.tar.gz
node_exporter-1.0.1.linux-amd64/
node_exporter-1.0.1.linux-amd64/NOTICE
node_exporter-1.0.1.linux-amd64/node_exporter
node_exporter-1.0.1.linux-amd64/LICENSE
# mv node_exporter-1.0.1.linux-amd64/* /var/lib/prometheus/node_exporter
# chown -R prometheus:prometheus /var/lib/prometheus/node_exporter/
Step:4 To create a systemd configuration file for Node_Exporter.
# vi /usr/lib/systemd/system/node_exporter.service
[Unit]
Description=Node Exporter
Wants=network-online.target
After=network-online.target

[Service]
User=prometheus
ExecStart=/var/lib/prometheus/node_exporter/node_exporter

[Install]
WantedBy=default.target
Step:5 To start the Node_Exporter service.
# systemctl enable --now node_exporter.service
Created symlink from /etc/systemd/system/default.target.wants/node_exporter.service to /usr/lib/systemd/system/node_exporter.service.
# systemctl status node_exporter.service
Step:6 To allow node_exporter service port port in firewall, if firewall service is running.
# firewall-cmd --add-port=9100/tcp --permanent
success
# firewall-cmd --reload
success
Add a Target in Prometheus Server:
Step:1 To edit Prometheus configuration file and add the target.
# vi /etc/prometheus/prometheus.yml

::::::::::::: CUT SOME OUTPUT :::::::::::::
# Here it's Prometheus itself.
scrape_configs:
  # The job name is added as a label `job=<job_name>` to any timeseries scraped from this config.
  - job_name: 'prometheus'

    # metrics_path defaults to '/metrics'
    # scheme defaults to 'http'.

    static_configs:
    - targets: ['localhost:9090']

  - job_name: 'node_exporter'
    static_configs:
    - targets: ['localhost:9100']
Step:2 To restart the Prometheus service to effect changes.
# systemctl restart prometheus
# systemctl status prometheus
Step:3 From the http://<prometheus_ipaddress>:9090/ GUI at client's browser, we can search for the node metrics, e.g. node_memory_MemAvailable_bytes metric. as below

seems like good to go for the next
Installing Grafana:
Step:1 To install required rpm's or packages from the grafana.com download site.
# wget https://dl.grafana.com/oss/release/grafana-7.1.1-1.x86_64.rpm
# yum install grafana-7.1.1-1.x86_64.rpm

::::::::::::: CUT SOME OUTPUT :::::::::::::
Installed:
  grafana.x86_64 0:7.1.1-1

Dependency Installed:
  urw-fonts.noarch 0:2.4-16.el7
Step:2 To configure the smtp connection in grafana service, that can be used for sending emails.
::::::::::::: CUT SOME OUTPUT :::::::::::::
#################################### SMTP / Emailing ##########################
[smtp]
enabled = true
host = localhost:25
user =
# If the password contains # or ; you have to wrap it with triple quotes. Ex """#password;"""
password =
cert_file =
key_file =
skip_verify = false
from_address = admin@grafana.localhost
from_name = Grafana
# EHLO identity in SMTP dialog (defaults to instance_name)
ehlo_identity =
# SMTP startTLS policy (defaults to 'OpportunisticStartTLS')
;startTLS_policy = NoStartTLS
::::::::::::: CUT SOME OUTPUT :::::::::::::
Step:3 To start the grafana service.
# systemctl daemon-reload
# systemctl enable grafana-server.service
Created symlink from /etc/systemd/system/multi-user.target.wants/grafana-server.service to /usr/lib/systemd/system/grafana-server.service.

# systemctl start grafana-server.service
# systemctl status grafana-server.service
Step:4 To allow grafana service port port in firewall, if firewall service is running.
# firewall-cmd --add-port=3000/tcp --permanent
success
# firewall-cmd --reload
success
Step:5 To verify the grafana service, open the URL http://<grafana_ipaddress>:3000 using a client's browser.

Note: The default login is username ‘admin’ and password ‘admin’.
wow it' very good to go for the next.
Grafana Configuration:
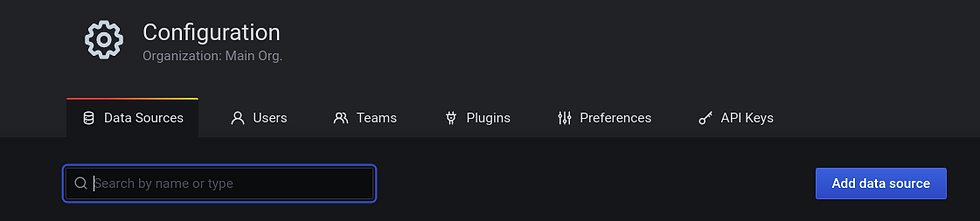
Step:1 To configure the our Prometheus instance as a data source
Click the Data Sources from the Configuration as below.

Click the Add Data Sources from the Data Sources windows as below.
Click the Select Prometheus from the Add Data Sources windows as below.

Click the save and test the confirmation from the Data Sources/Prometheus windows as below.

Now, we have successfully configure Prometheus in the Grafana.
Step:2 To configure the our Prometheus instance as a data source
Click the Manage from the Dashboard as below.

Click the Import from the Manage as below.

Import the dashboard Node Exporter for Prometheus Dashboard EN v20200628 by StarsL.cn the dashboard id 11074, as below.

Step:3 To verify the metrics for my server such as CPU usage or free memory.

Step:4 If we monitor multiple servers, we can switch between them by clicking next to the text ‘JOB’, as below.

Note: Additional servers will appear here if you add them to the Prometheus configuration:
- job_name: 'allinone'
static_configs:
- targets: ['localhost:9100','allinonehost']
Step:4 To set up altering via smtp for the dashboard:
Click the Add Channel from the Alerting as below.

Click the save the confirmation and send test the Notification from the Notification Channel windows, as below.

We can configure the email Notification from the monitoring dashboards that suit for our requirements, if needed.
We now have a fully functional Prometheus ecosystem running on your RHEL 7 server, and we can use Grafana to customize monitoring dashboards that suit our requirements.


Comments