


User Application or Workload Monitoring on OpenShift Container Platform
- Munshi Hafizul Haque

- Oct 2, 2021
- 6 min read
Let’s assume a running application has been deployed to the RHOCP cluster inside a project (or namespace) called uat1, and that the Prometheus metrics endpoint is exposed on path /metrics.
In RHOCP 4.6, application monitoring can be set up by enabling monitoring for user-defined projects without the need to install an additional monitoring solution. This solution will deploy a second Prometheus Operator instance inside the openshift-user-workload-monitoring namespace that is configured to monitor all namespaces excluding the openshift- prefixed namespaces already monitored by the cluster's default platform monitoring.
Note: To understanding the monitoring stack for OpenShift Container Platform: https://docs.openshift.com/container-platform/4.6/monitoring/understanding-the-monitoring-stack.html
Let’s start the configuration as follows.
Step1: To enabling monitoring for user-defined projects:
Source Link: https://docs.openshift.com/container-platform/4.6/monitoring/enabling-monitoring-for-user-defined-projects.html
# oc -n openshift-monitoring edit configmap cluster-monitoring-config
# Please edit the object below. Lines beginning with a '#' will be ignored,
# and an empty file will abort the edit. If an error occurs while saving this file will be
# reopened with the relevant failures.
#
apiVersion: v1
data:
  config.yaml: |
    enableUserWorkload: true
    prometheusK8s:
      retention: 24h
kind: ConfigMap
metadata:
  creationTimestamp: "2021-09-27T12:00:54Z"
  name: cluster-monitoring-config
  namespace: openshift-monitoring
  resourceVersion: "4912259"
  selfLink: /api/v1/namespaces/openshift-monitoring/configmaps/cluster-monitoring-config
  uid: 4590cb83-99e3-404b-92da-ffdeacbccc0d
Note: To check the prometheus-operator, prometheus-user-workload and thanos-ruler-user-workload pods are running in the openshift-user-workload-monitoring project.
# oc -n openshift-user-workload-monitoring get pod
NAME                                  READY   STATUS    RESTARTS   AGE
prometheus-operator-646cb67c9-qbr8z   2/2     Running   0          3d21h
prometheus-user-workload-0            4/4     Running   1          11h
prometheus-user-workload-1            4/4     Running   1          11h
thanos-ruler-user-workload-0          3/3     Running   0          4d15h
thanos-ruler-user-workload-1      3/3 Running   0      4d11h
Step2: To add the necessary permission to your user using: (Optional)
Though cluster administrators can monitor all core OpenShift Container Platform and user-defined projects. you can grant developers and other users permission to monitor their own projects if required.
As an Example, To assign the user-workload-monitoring-config-edit role to a ocp4user1 in the openshift-user-workload-monitoring project:
# oc -n openshift-user-workload-monitoring adm policy add-role-to-user user-workload-monitoring-config-edit ocp4user1 --role-namespace openshift-user-workload-monitoringStep3: To set up metrics collection for the application projects apart from projects named openshift-*:
We are going to use the prometheus-example-app example application and then to verify its available metrics to view. In this example, it is called sample-http-service.yaml to create a YAML file for the service configuration.
# cat sample-http-service.yaml
apiVersion: v1
kind: Namespace
metadata:
  name: uat1
---
apiVersion: apps/v1
kind: Deployment
metadata:
  labels:
    app: http-sample
  name: http-sample
  namespace: uat1
spec:
  replicas: 1
  selector:
    matchLabels:
      app: http-sample
  template:
    metadata:
      labels:
        app: http-sample
    spec:
      containers:
      - image: ghcr.io/rhobs/prometheus-example-app:0.3.0
        imagePullPolicy: IfNotPresent
        name: http-sample
---
apiVersion: v1
kind: Service
metadata:
  labels:
    app: http-sample
  name: http-sample
  namespace: uat1
spec:
  ports:
  - port: 8080
    protocol: TCP
    targetPort: 8080
    name: 8080-tcp
  selector:
    app: http-sample
  type: ClusterIP
---
apiVersion: route.openshift.io/v1
kind: Route
metadata:
  labels:
    app: http-sample
  name: http-sample
  namespace: uat1
spec:
  host: http-sample-uat1.apps.ocp-prod.jazakallah.info
  port:
    targetPort: 8080-tcp
  to:
    kind: Service
    name: http-sample
    weight: 100
  wildcardPolicy: None

# oc apply -f  sample-http-service.yaml

# oc get pod -n uat1
NAME                           READY   STATUS    RESTARTS   AGE
http-sample-6b47b86c6d-wc54g   1/1     Running   0          8m48s

# oc get route -n uat1
NAME          HOST/PORT                                              PATH   SERVICES      PORT       TERMINATION   WILDCARD
http-sample   http-sample-uat1.apps.ocp-prod.jazakallah.info         http-sample   8080-tcp                 None

# curl http-sample-uat1.apps.ocp-prod.jazakallah.info
Hello from example application.
Now we have the exposed metrics through an HTTP service endpoint under the /metrics canonical name. We can list all available metrics for a service by running a curl query against http://<endpoint>/metrics.
For instance, We have exposed a route to the application http-sample and now run the following to view all of its available metrics:
# curl http-sample-uat1.apps.ocp-prod.jazakallah.info/metrics
# HELP http_request_duration_seconds Duration of all HTTP requests
# TYPE http_request_duration_seconds histogram
http_request_duration_seconds_bucket{code="200",handler="found",method="get",le="0.005"} 6

::::::::::::: CUT SOME OUTPUT :::::::::::::

http_request_duration_seconds_bucket{code="200",handler="found",method="get",le="+Inf"} 6
http_request_duration_seconds_sum{code="200",handler="found",method="get"} 7.1784e-05
http_request_duration_seconds_count{code="200",handler="found",method="get"} 6
# HELP http_requests_total Count of all HTTP requests
# TYPE http_requests_total counter
http_requests_total{code="200",method="get"} 6
# HELP version Version information about this binary
# TYPE version gauge
version{version="v0.3.0"} 1
Step4: To create a resource name servicemonitor:
We need to create a resource name servicemonitor, for that first deployment of the application.. In this example, the file is called uat1-app-service-monitor.yaml to create a YAML file for the ServiceMonitor resource configuration:
# cat uat1-app-service-monitor.yaml
apiVersion: monitoring.coreos.com/v1
kind: ServiceMonitor
metadata:
  labels:
    k8s-app: http-sample-monitor
  name: http-sample-monitor
  namespace: uat1
spec:
  endpoints:
  - interval: 30s
    port: 8080-tcp
    scheme: http
  selector:
    matchLabels:
      app: http-sample

# oc apply -f uat1-app-service-monitor.yaml
# oc apply -f uat1-app-service-monitor.yaml
servicemonitor.monitoring.coreos.com/php-sample-monitor created
# oc get servicemonitor
NAME AGE
php-sample-monitor 4sStep5: To verify and query metrics:
Source Links: https://prometheus.io/docs/prometheus/latest/querying/basics/, https://prometheus.io/docs/prometheus/latest/querying/functions &
we can access metrics for a user-defined project as a developer or as a user with view permissions for the project as below:

Step 6: To create the custom alerting rule for the sample app:
Note: We can create our own expression (expr) based on the Prometheus's query.
Example: absent (count ( version{job="http-sample"} == 1 )) == 1 to check running pods status, if --replicas=0.
To use the metrics exposed by your service, we must configure OpenShift Container Platform monitoring to scrape metrics from the /metrics endpoint, as bellow:
# cat uat1-app-alerting-rule2.yaml
apiVersion: monitoring.coreos.com/v1
kind: PrometheusRule
metadata:
  name: http-sample-alert-critical
  namespace: uat1
spec:
  groups:
  - name: pod-mon
    rules:
    - alert: Service available without HA
      annotations:
        message: '1 pod running in the {{ $labels.namespace }}.'
        description: 'At least two pods have to run for the Service availability with HA'
        summary: Please verify the deployment configuration and or replica.
      expr: count ( version{job="http-sample"}  == 1 ) == 1
      for: 30s
      labels:
        severity: critical
---
apiVersion: monitoring.coreos.com/v1
kind: PrometheusRule
metadata:
  name: http-sample-alert-warning
  namespace: uat1
spec:
  groups:
  - name: rc-mon
    rules:
    - alert: Service available with a minimum HA requirement
      annotations:
        message: '2 pod running in the {{ $labels.namespace }}.'
        description: 'Three pods have to run for the Service availability with Recommended HA requirement.'
        summary: Please verify the deployment configuration and or replica.
      expr: count ( version{job="http-sample"}  == 1 ) == 2
      for: 30s
      labels:
        severity: warning
# oc apply -f uat1-app-alerting-rule2.yaml
prometheusrule.monitoring.coreos.com/http-sample-alert-critical created
prometheusrule.monitoring.coreos.com/http-sample-alert-warning created# oc get prometheusrule
NAME AGE
http-sample-alert-critical 14s
http-sample-alert-warning 14sStep7: To verify alerting rule for the sample app
As we can see we have three replica running as below:
# oc get pod
NAME                           READY   STATUS    RESTARTS   AGE
http-sample-6b47b86c6d-8bg26   1/1     Running   0          72s
http-sample-6b47b86c6d-wd5n9   1/1     Running   0          72s
http-sample-6b47b86c6d-xxxdt   1/1     Running   0          72s
Now let us bring down the replica and see the alerts for the Recommended HA requirement.
# oc scale deploy http-sample --replicas=2
deployment.apps/http-sample scaled
# oc get pod
NAME READY STATUS RESTARTS AGE
http-sample-6b47b86c6d-8bg26 1/1 Running 0 2m10s
http-sample-6b47b86c6d-xxxdt 1/1 Running 0 2m10s
Now let us bring down the replica again and see the alerts for the HA requirement.
# oc scale deploy http-sample --replicas=1
deployment.apps/http-sample scaled
# oc get pod
NAME                           READY   STATUS    RESTARTS   AGE
http-sample-6b47b86c6d-8bg26   1/1     Running   0          4m54s

Okay, as we have observed that our alerts rules are working fine. let's send those alerts notifications to external receivers by email.
Step8: To Configure alertmanager to send notifications to external receivers by email:
Source Link: https://docs.openshift.com/container-platform/4.6/monitoring/managing-alerts.html#configuring-alert-receivers_managing-alerts & https://prometheus.io/docs/alerting/latest/configuration/
To print the currently active Alertmanager configuration into file alertmanager.yaml
# oc -n openshift-monitoring get secret alertmanager-main --template='{{ index .data "alertmanager.yaml" }}' |base64 -d > alertmanager.yamlWe had changed the necessary configuration in file alertmanager.yaml, adding the smtp server and alerts messages sent by email.
# cat alertmanager.yaml
global:
  resolve_timeout: 5m
  smtp_from: "no-reply@ocp-prod.jazakallah.info"
  smtp_smarthost: "bastion.ocp-prod.jazakallah.info:25"
  smtp_hello: "bastion.ocp-prod.jazakallah.info"
  smtp_require_tls: false
route:
  group_wait: 30s
  group_interval: 5m
  repeat_interval: 5m
  receiver: email
  routes:
  - match:
      alertname: Watchdog
    repeat_interval: 5m
    receiver: watchdog
  - match:
      severity: critical
    repeat_interval: 5m
    receiver: email
receivers:
- name: default
- name: watchdog
- name: email
  email_configs:
    - to: "ocp4admin@ocp-prod.jazakallah.info"
To apply the new configuration in the file:
# oc -n openshift-monitoring create secret generic alertmanager-main --from-file=alertmanager.yaml --dry-run -o=yaml | oc -n openshift-monitoring replace secret --filename=-Note: if you have smtp authentication as well as TLS/SSL enable then you need the necessary configuration as per your environment. Example:
smtp_hello: "smtp.gmail.com"
smtp_from: "sender@gmail.com"
smtp_smarthost: "smtp.gmail.com:587"
smtp_auth_username: "sender@gmail.com"
smtp_auth_password: "PLACE-APP-PASSWORD"
smtp_require_tls: true
Step9: To verify alerts from my Email Server:
Now, we have received those alerts notifications at my email address and can see the email alerts in our webmail web console.

Step10: To create the custom alerting for the existing project and its own project and cluster metrics:
The user-defined alerting rule can include metrics for its own project and cluster metrics. But we cannot include metrics for another user-defined project.
For example, an alerting rule for the user-defined Project (namespace) uat1 can have metrics from uat1 and cluster metrics, such as the CPU and memory metrics. However, the rule cannot include metrics from uat2.
Lets verify and query own project and cluster metrics metrics for our existing Project (namespace) uat2:

To verify the existing applications labels and name details:
# oc get deployment.apps/httpd-sample -o yaml |grep  name
    alpha.image.policy.openshift.io/resolve-names: '*'
    image.openshift.io/triggers: '[{"from":{"kind":"ImageStreamTag","name":"httpd-sample:latest","namespace":"uat2"},"fieldPath":"spec.template.spec.containers[?(@.name==\"httpd-sample\")].image","pause":"false"}]'
    app.kubernetes.io/name: httpd
          f:alpha.image.policy.openshift.io/resolve-names: {}
          f:app.kubernetes.io/name: {}
              k:{"name":"httpd-sample"}:
                f:name: {}
              k:{"name":"httpd-sample"}:
  name: httpd-sample
  namespace: uat2
  selfLink: /apis/apps/v1/namespaces/uat2/deployments/httpd-sample
        name: httpd-sample
To verify the existing service details:
# oc get service/httpd-sample -o yaml |grep -A5 ports
        f:ports:
          .: {}
          k:{"port":8080,"protocol":"TCP"}:
            .: {}
            f:name: {}
            f:port: {}
--
  ports:
  - name: 8080-tcp
    port: 8080
    protocol: TCP
    targetPort: 8080
  - name: 8443-tcp
To create a resource name servicemonitor:
# cat uat2-app-service-monitor.yaml
apiVersion: monitoring.coreos.com/v1
kind: ServiceMonitor
metadata:
  labels:
    k8s-app: httpd-sample-monitor
  name: httpd-sample-monitor
  namespace: uat2
spec:
  endpoints:
  - interval: 30s
    port: 8080-tcp
    path: /metrics
    scheme: http
  selector:
    matchLabels:
      app: httpd-sample

# oc apply -f uat2-app-service-monitor.yaml
servicemonitor.monitoring.coreos.com/httpd-sample-monitor created
To create the custom alerting rule for the sample app:
# cat uat2-app-alerting-rule2.yaml
apiVersion: monitoring.coreos.com/v1
kind: PrometheusRule
metadata:
name: httpd-sample-alert-critical
namespace: uat2
spec:
groups:
- name: pod-mon
rules:
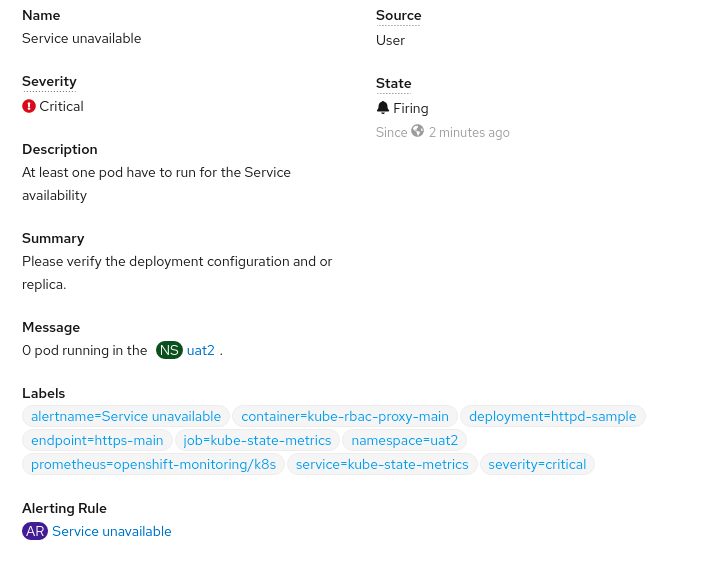
- alert: Service unavailable
annotations:
message: '0 pod running in the {{ $labels.namespace }}.'
description: 'At least one pod have to run for the Service availability'
summary: Please verify the deployment configuration and or replica.
expr: kube_deployment_status_replicas_updated{deployment="httpd-sample",endpoint="https-main",namespace="uat2"} == 0
for: 30s
labels:
severity: critical
# oc apply -f uat2-app-alerting-rule2.yaml
prometheusrule.monitoring.coreos.com/httpd-sample-alert-critical created
# oc get pod
NAME                            READY   STATUS    RESTARTS   AGE
httpd-sample-574d568dcf-zbtv9   1/1     Running   0          4d17h
# oc scale deploy httpd-sample --replicas=0
deployment.apps/httpd-sample scaled
# oc get pod
No resources found in uat2 namespace.
Click the "view details" and will have the alerts details:
Hope this post will help.
Some Source links for your reference:
user-workload-monitoring: make the ServiceMonitor and PrometheusRule namespaces configurable: https://access.redhat.com/solutions/6112141
alerts PrometheusNotIngestingSamples / PrometheusNotConnectedToAlertmanagers activated and scrape manager errors in prometheus: https://access.redhat.com/solutions/5514091


Comments